Bike Stress Map
Bike Stress Map
Bike Stress Map
Your tool for navigating—and improving—Boston’s streets.
Work for
Boston Cyclists Union
Boston Cyclists Union
Tools
Figma, Mapbox,
HTML, CSS
Figma, Mapbox, HTML, CSS
Role
Product Designer
Product Designer
Year
2024
2024
Project Overview:
Project Overview:
What makes a street great for cycling? Separated bike lanes, low car speeds, light traffic, wide lanes, or a mixture of all of them? How can I find the best streets around me without riding on them one-by-one.
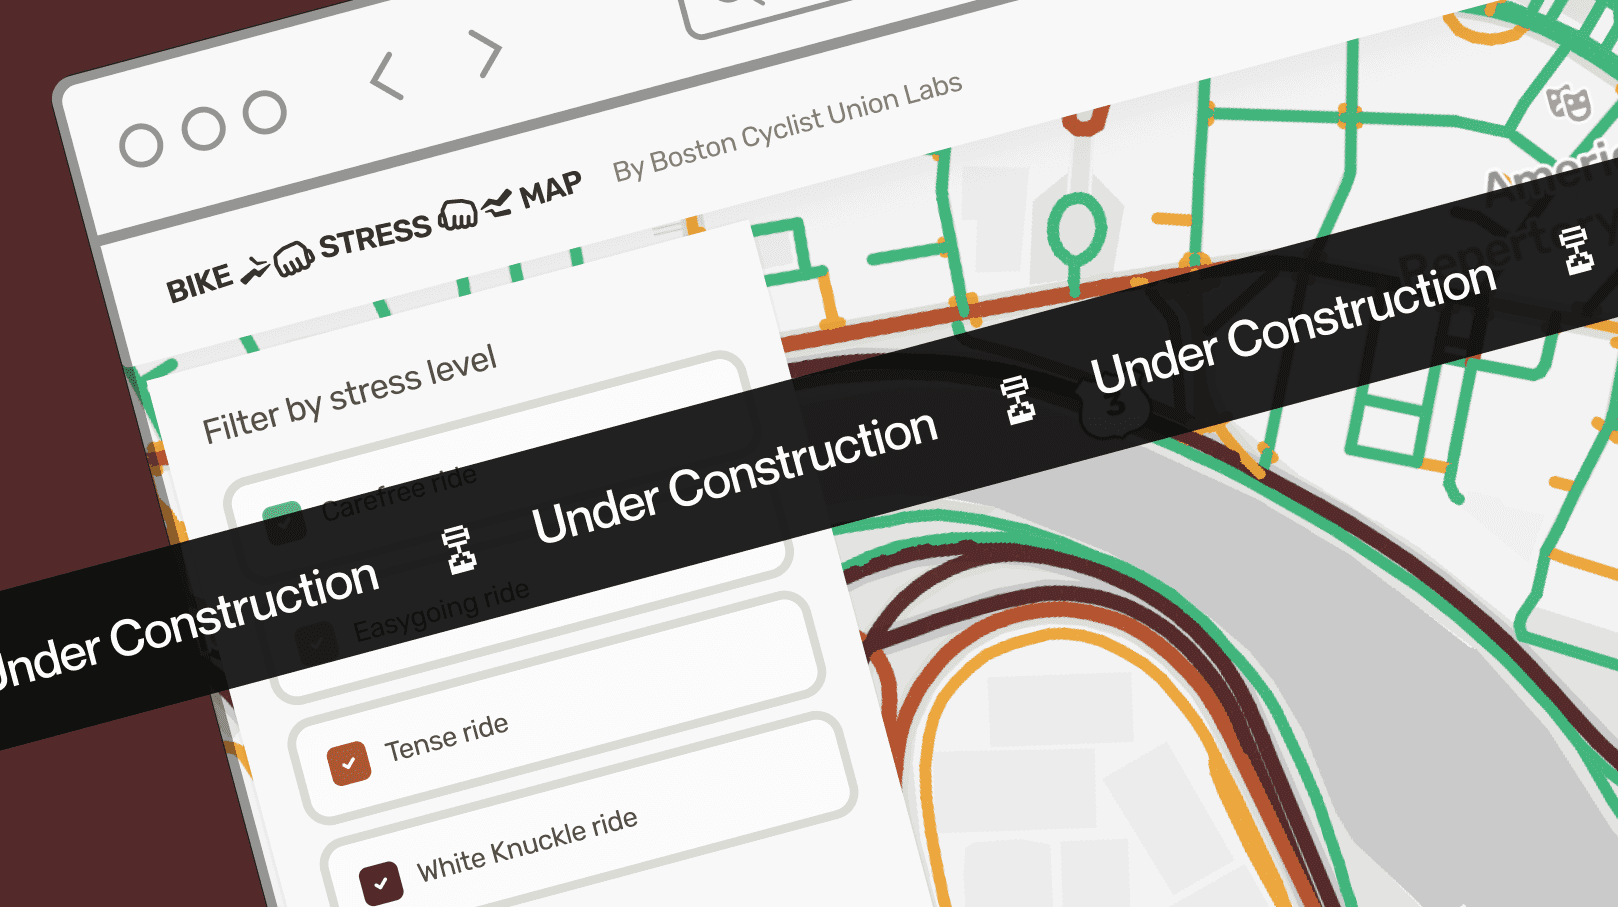
I worked with Boston Cyclist Union Labs, an area cycling advocacy collective, to design and build a web app which displays the Level of Stress of all streets, and displays the info that makes it up.
What makes a street great for cycling? Separated bike lanes, low car speeds, light traffic, wide lanes, or a mixture of all of them? How can I find the best streets around me without riding on them one-by-one.
I worked with Boston Cyclist Union Labs, an area cycling advocacy collective, to design and build a web app which displays the Level of Stress of all streets, and displays the info that makes it up.
Approach:
Approach:
When I joined Boston Cyclists Union they already had a proof of concept. My role was to take the dense and techie mapping function and make it as easy to understand as possible.
When I joined Boston Cyclists Union they already had a proof of concept. My role was to take the dense and techie mapping function and make it as easy to understand as possible.
When I joined Boston Cyclists Union they already had a proof of concept. My role was to take the dense and techie mapping function and make it as easy to understand as possible.
Building upon a body of research on Level of Traffic Stress (LTS)
Building upon a body of research on Level of Traffic Stress (LTS)
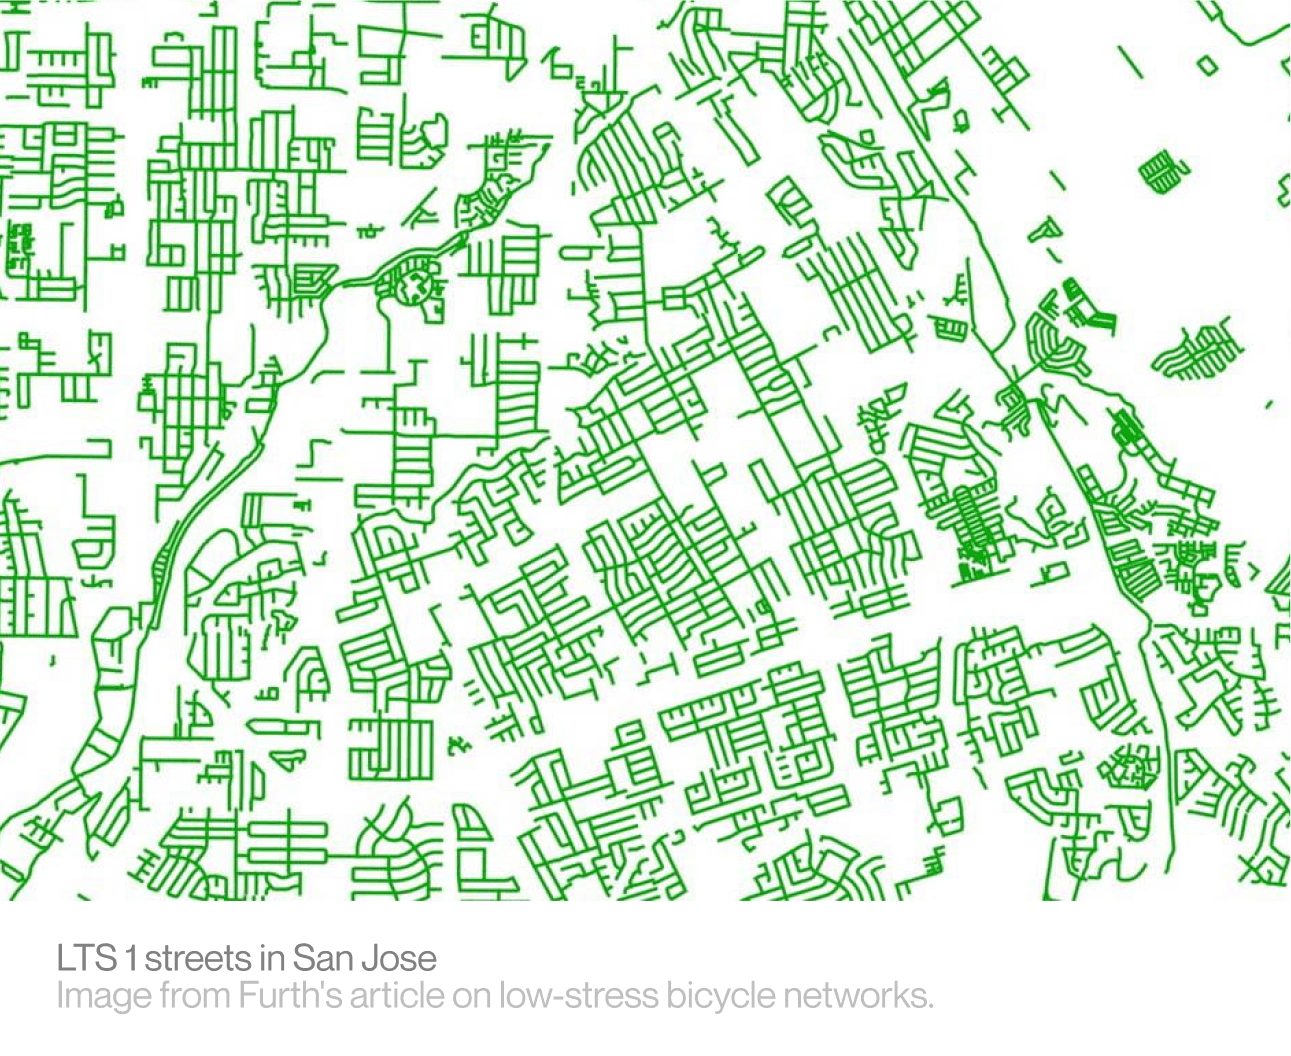
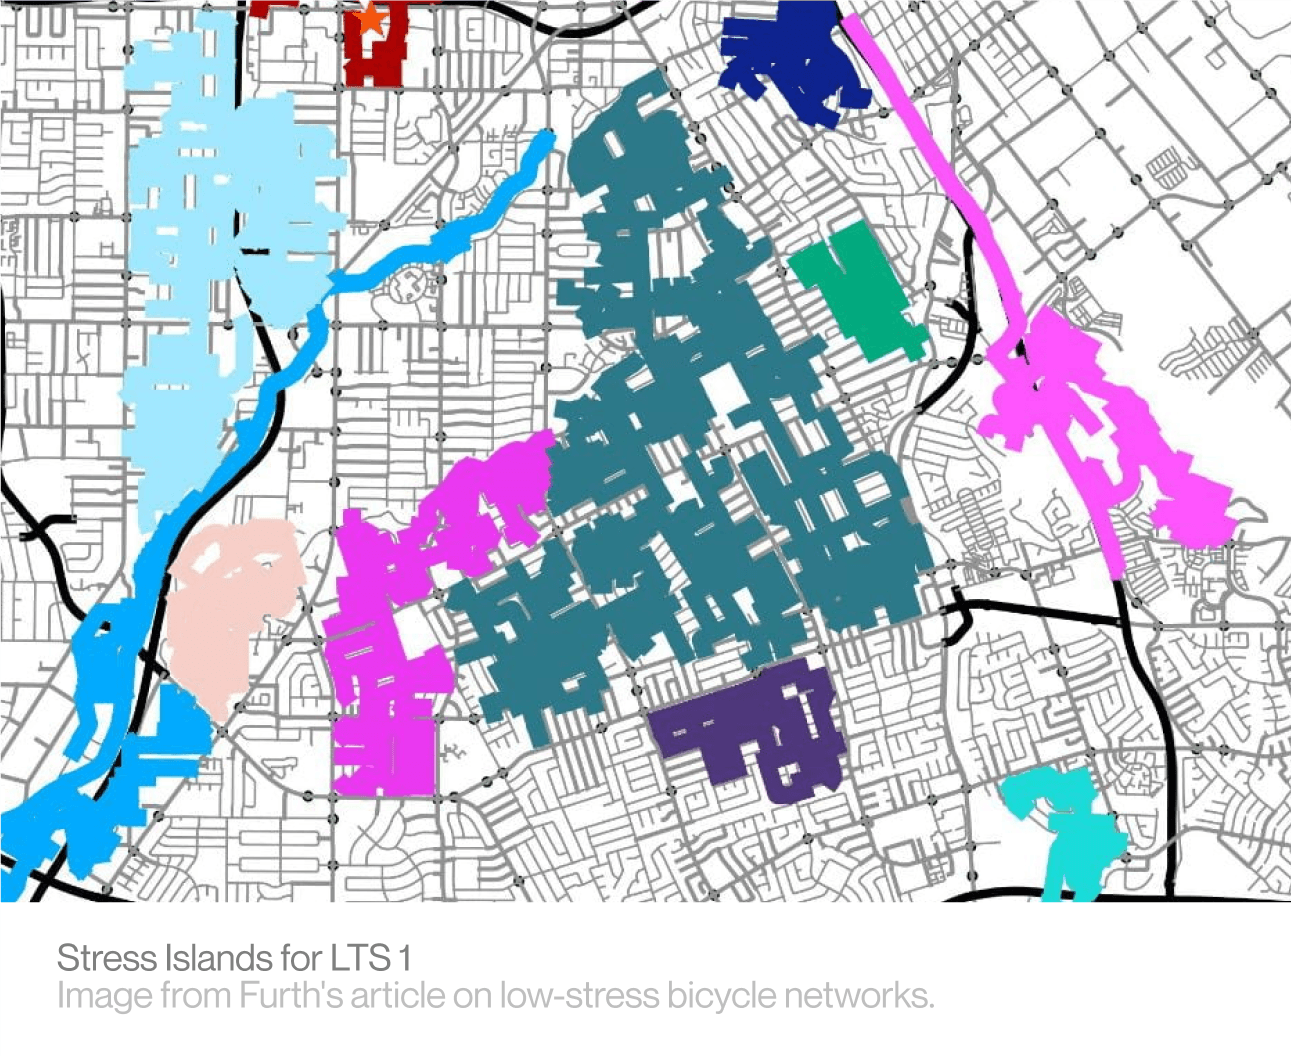
Level of Traffic Stress (LTS) is a concept developed by Peter Furth of Northeastern University. It's a method of quantifying one's experience cycling on a street by assessing it's design and traffic volumes. LTS is graded on a four point scale, where LTS-1 is the most comfortable for most riders, and LTS-4 is the most stressful. LTS can be used to map islands of bike accessibility.
Level of Traffic Stress (LTS) is a concept developed by Peter Furth of Northeastern University. It's a method of quantifying one's experience cycling on a street by assessing it's design and traffic volumes. LTS is graded on a four point scale, where LTS-1 is the most comfortable for most riders, and LTS-4 is the most stressful. LTS can be used to map islands of bike accessibility.
Level of Traffic Stress (LTS) is a concept developed by Peter Furth of Northeastern University. It's a method of quantifying one's experience cycling on a street by assessing it's design and traffic volumes. LTS is graded on a four point scale, where LTS-1 is the most comfortable for most riders, and LTS-4 is the most stressful. LTS can be used to map islands of bike accessibility.

Role
Product Designer
Year
2024
Tools
Figma, Mapbox, HTML, CSS
Work for
Boston Cyclists Union
My role: Raising ambitions, and making the traffic stress tool intuitive.
My role: Raising ambitions, and making the traffic stress tool intuitive.
The Boston Cyclists Union was eager to share their tool with the data-savvy urbanist community. When I joined the project, I helped expand its capabilities and elevate their ambitions. Through user research and thoughtful design polish, we transformed the tool into something accessible and understandable for a broader audience.
The Boston Cyclists Union was eager to share their tool with the data-savvy urbanist community. When I joined the project, I helped expand its capabilities and elevate their ambitions. Through user research and thoughtful design polish, we transformed the tool into something accessible and understandable for a broader audience.
The Boston Cyclists Union was eager to share their tool with the data-savvy urbanist community. When I joined the project, I helped expand its capabilities and elevate their ambitions. Through user research and thoughtful design polish, we transformed the tool into something accessible and understandable for a broader audience.


